To empower Philadelphians to reduce cancer disparities through community engagement, resource alignment, information sharing, research, and prevention.
Background
Cancer is the second leading cause of death in Philadelphia; in 2018, 7,763 residents were diagnosed with cancer and 2,947 died of their disease. For almost every major cancer, incidence and mortality rates for Philadelphians are higher than state or national rates. (Table 1). Cancer burden is unequally distributed among neighborhoods in Philadelphia, with the highest burden seen in neighborhoods in North and West Philadelphia. Neighborhoods with a high cancer burden in Philadelphia are also neighborhoods with high concentration of poverty. (Figure 1)

Cancer risk factors, including obesity, smoking, alcohol consumption, physical inactivity, poor diet, and environmental exposures are disproportionately higher in Philadelphia as compared to national averages. Like many urban cities, these rates are higher among racial and ethnic minorities, and vary across geographic neighborhoods. Neighborhoods in North and West Philadelphia, which have the highest rates of poverty and greatest cancer burden, also have the highest rates of cancer risk factors. Social determinants of health are major contributors to cancer disparities; minority and ethnic populations are more likely to live in medically underserved areas, have low health literacy, and face additional barriers to accessing cancer care such as transportation, inability to take time off work, and lack of health insurance.
Table 1. Cancer Incidence, Mortality and Rate Ratios in Philadelphia.1
| Cancer Incidence | Cancer Mortality | |||||
| Cancer Site | Phila. | US | IRR3 | Phila. | US | SMR4 |
| All Sites | 502.2 | 435.9 | 1.15 | 190.2 | 158.3 | 1.20 |
| Breast (F) | 123.9 | 124.9 | 0.99 | 25.0 | 20.3 | 1.23 |
| Prostate (M) | 138.2 | 103.2 | 1.34 | 27.2 | 19.1 | 1.42 |
| Lung | 77.0 | 57.7 | 1.33 | 50.1 | 40.2 | 1.25 |
| Colorectal | 45.3 | 38.5 | 1.18 | 17.3 | 13.9 | 1.24 |
| Bladder | 20.5 | 19.8 | 1.04 | 4.8 | 4.4 | 1.09 |
| Leukemia | 11.6 | 13.6 | 0.85 | 5.5 | 6.4 | 0.86 |
| NHL | 20.4 | 19.2 | 1.06 | 5.3 | 5.5 | 0.96 |
| Kidney/Renal | 21.2 | 16.4 | 1.29 | 3.4 | 3.7 | 0.92 |
| Pancreas | 15.1 | 12.7 | 1.19 | 13.4 | 11.0 | 1.22 |
| Liver | 15.6 | 8.5 | 1.84 | 7.8 | 4.9 | 1.59 |
| Cervix (F) | 10.6 | 7.6 | 1.39 | 3.6 | 2.3 | 1.57 |
1 Data from 2013-2017
2Data from 2000-2016
3Incidence Rate Ratio
4Standardized Mortality Ratio
References
- The City of Philadelphia. Health of the City. City of Philadelphia Department of Public Health; 2020. Available at: https://www.phila.gov/media/20201230141933/HealthOfTheCity-2020.pdf
- Surveillance, Epidemiology, and End Results (SEER) Program (www.seer.cancer.gov) SEER*Stat Database: Mortality – All COD, Aggregated With County, Total U.S. (1990-2017) <Katrina/Rita Population Adjustment> – Linked To County Attributes – Total U.S., 1969-2018 Counties, National Cancer Institute, DCCPS, Surveillance Research Program, released December 2019. Underlying mortality data provided by NCHS (www.cdc.gov/nchs).
- Drexel University Urban Health Collaborative. Cancer in Philadelphia Neighborhoods. Drexel University; 2021. Available at: https://drexel.edu/uhc/about/News/2021/January/Cancer%20in%20Philadelphia%20Neighborhoods/
- Alcaraz KI, Wiedt TL, Daniels EC, Yabroff KR, Guerra CE, Wender RC. Understanding and addressing social determinants to advance cancer health equity in the United States: A blueprint for practice, research, and policy. CA Cancer J Clin. 2020;70(1):31-46.

Publications
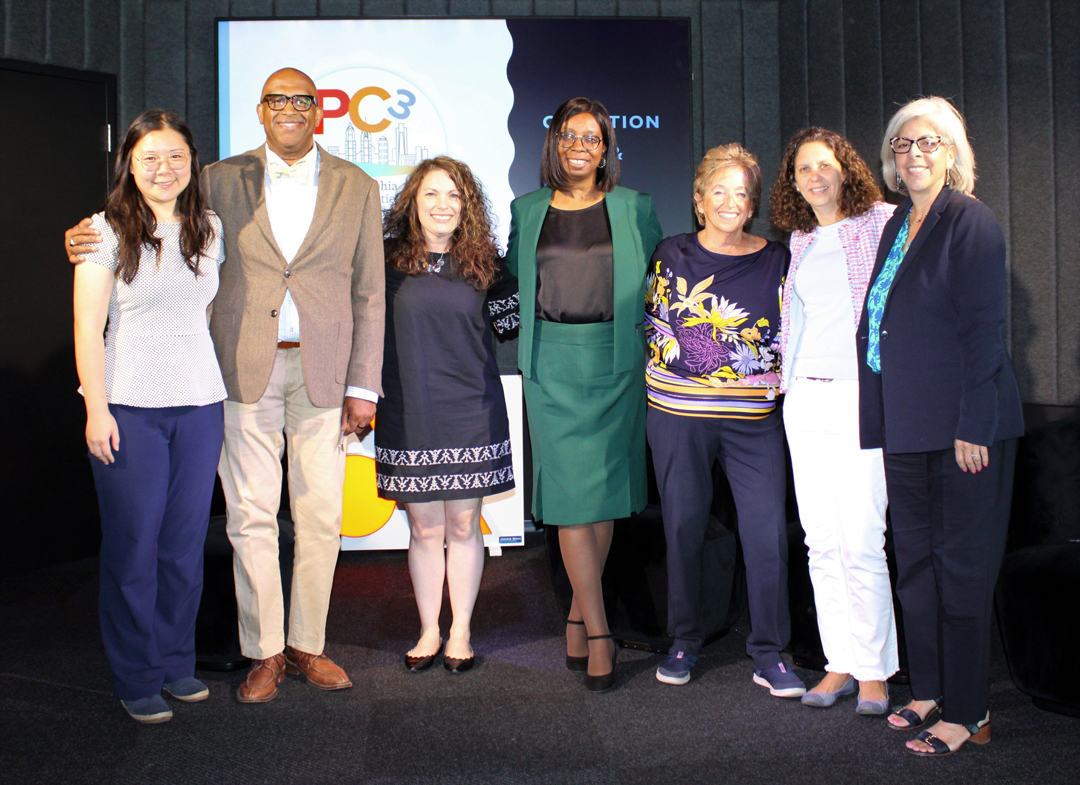
City-Wide Cancer Disparities Conference
June 15, 2023
Health systems, cancer centers, stakeholders, and community members discussed concerns about cancer in Philadelphia and charted a path forward to reduce disparities in our city.